Jan 10, 2026
Server QC Automation System
How I built a fully automated server QC pipeline using Python and FastAPI, eliminating manual processes and boosting daily throughput by 260% through IPMI, Redfish API, and iPXE integration.
A solo infrastructure automation project that eliminated all manual steps in the server shipping QC process using Python and FastAPI, boosting productivity by 260%.
1. Project Overview
- Duration: Nov 2023 – May 2024 (approx. 6 months, solo project)
- Role: Full system design, development, and operational process establishment
- Tech Stack:
- Language:
Python,Bash Shell - Framework:
FastAPI(Backend/Dashboard),iPXE(OS Booting) - Infra Control:
IPMI,Redfish API - Database:
MariaDB
- Language:
2. Problem Statement
What sparked this project and why
Our existing server QC process typically handled around 60 units per cycle. Every single step — powering on the server, entering and configuring the BIOS, installing the OS, running Bash scripts — had to be done by hand. Someone had to physically watch whether the OS was installing correctly, whether the scripts were running as expected, and whether the configuration values were actually applied. Every step required human eyes.
No matter how skilled the operator was, there was always an unavoidable time floor. And when delivery volumes suddenly spiked, the only answer was to work through the night.
That meant late nights became the norm during busy periods, and when that happens, operator fatigue directly impacts quality. The faster you need to go, the more mistakes creep in — and that was a structural problem we couldn't solve just by getting better at the job.
The core issues were:
- 1 (Low productivity): Engineers had to physically control and visually verify each server — hard ceiling of ~150 units per day.
- 2 (Human error): Since every step was manual, quality fluctuated with the operator's condition.
- 3 (No scalability): No matter how experienced the team, there's a physical limit to what humans can do — we couldn't respond quickly to large-volume orders.
I'd always been curious about how companies like Dell and HP, or domestic tech giants like Naver and Kakao, manage thousands of servers at scale. The turning point came when one of our executives visited a factory run by a major Chinese server manufacturer (Inspur) and came back saying: "They automate and manage every step of the process from a central system." That clicked something for me — if they can do it, why can't we?
And every year, deliveries would bunch up around certain periods, forcing us into the same cycle of all-nighters. No matter how much we improved individual skill, the wall was always there. Brute-forcing our way through it wasn't a strategy.
It started small — just experimenting with remote power control out of curiosity. But as I connected one piece to the next, I started to see the shape of something bigger. Eventually, I set a clear goal: build a fully unmanned, automated standard system that requires zero physical intervention, where operators control everything remotely from a central dashboard — maximizing speed while guaranteeing a 0% error rate.
3. System Architecture
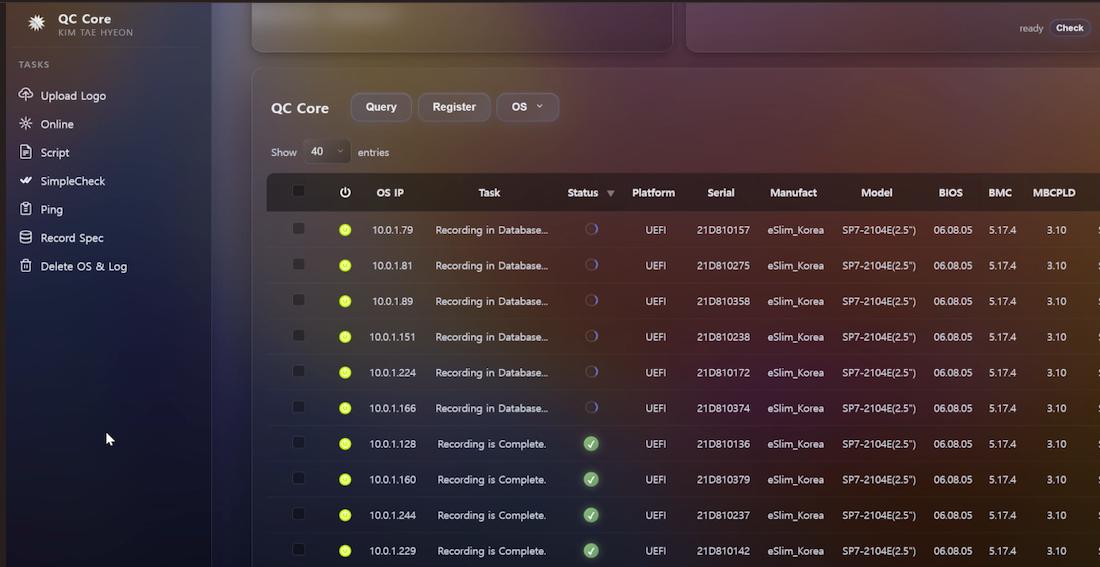
1. Workflow Sidebar (Left Sidebar - Workflow Control)
The left-side menu (Upload Logo → Online → Script → ...) is arranged in the exact order of the actual QC process.
Operators simply click buttons from top to bottom — no CLI commands, no guesswork. Just a standardized QC process that anyone can follow.
2. Real-time Status Monitoring
The Task & Status panel shows what the backend is currently doing (e.g., Recording in Database...) and reflects progress in real time.
A loading indicator and green checkmark make it immediately obvious whether an async task is still running or done.
Power Control displays each server's power state (On/Off) through icon color, so IPMI connectivity is visible at a glance.
3. Automatic Hardware Info Collection
The Serial, BIOS, and BMC Firmware values in the right-side table are pulled directly from MariaDB.
Once an operator finishes OS installation, a script automatically sends the current system state to the central DB. This lets operators see what's already been done and what still needs to happen — without asking anyone.
4. Real-time Server Health Check
The system continuously checks for issues like faulty memory seating, motherboard defects, disk anomalies (broken RAID), and redundant power supply failures, then surfaces them as alarm icons on the dashboard.
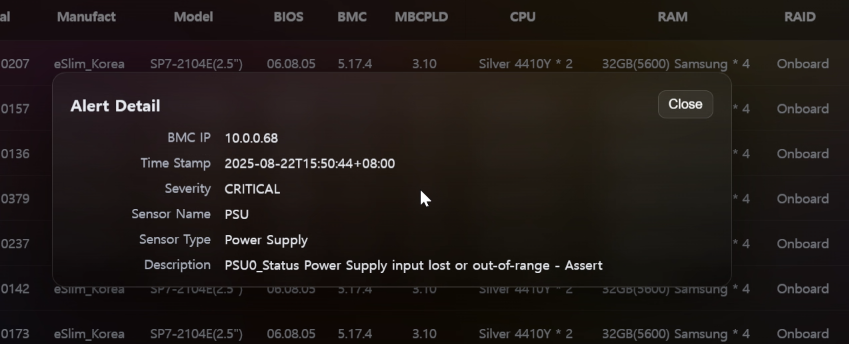
When a problem is detected, the alarm icon animates and turns red, showing the affected BMC IP and severity level.
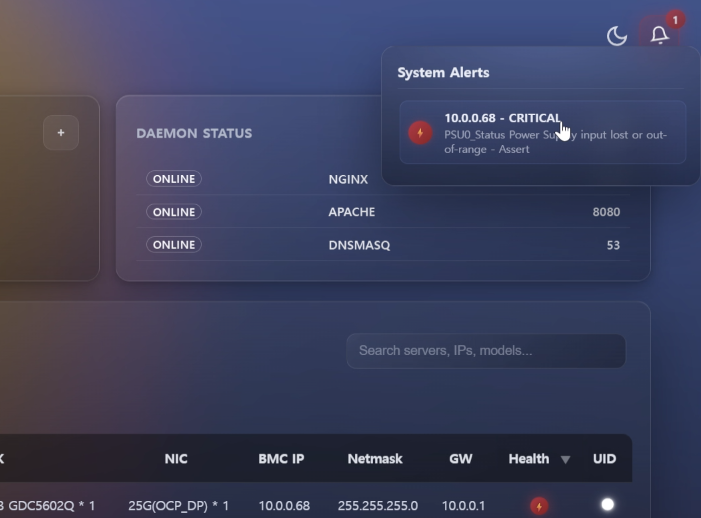
Additional detail — including timestamp, source of the issue, and a full description — is displayed on demand.
Once the issue resolves, the alarm icon and Health status automatically return to their normal state.
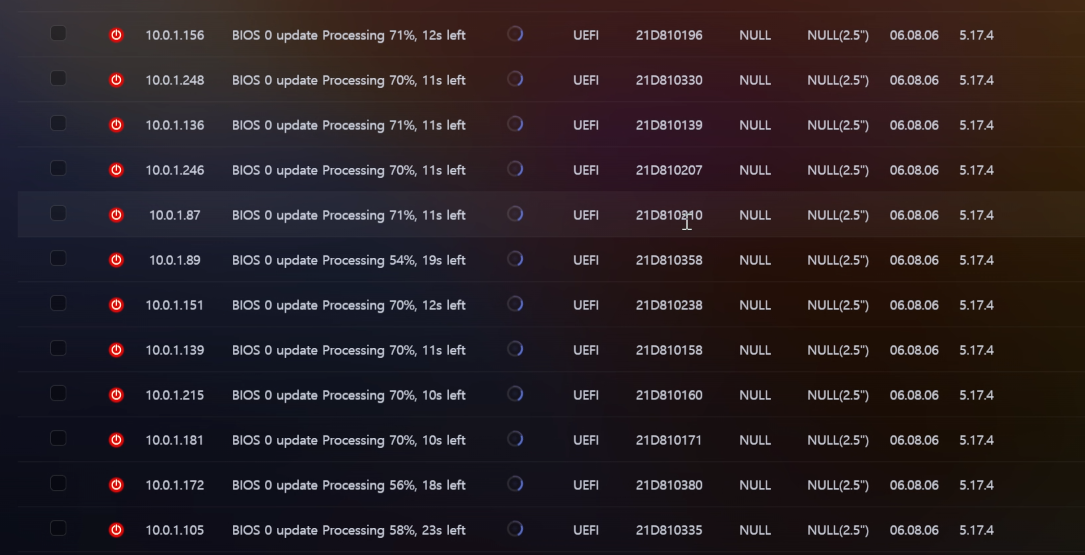
5. Real-time Firmware Update Progress
BIOS and BMC firmware update progress is reflected on the dashboard every second, so operators always know exactly where each server is in the update process.
Every step of the QC process was designed with the end user in mind — not the developer. The goal was simple: anyone should be able to run a complete QC cycle quickly, correctly, and without prior expertise.
4. Key Results
- Productivity: Daily throughput increased from 150 → 540 units (+260%)
- Quality: Shipping defect rate due to human error reduced to 0%
- Operational efficiency: A standardized system that anyone can operate with just a manual — no deep technical background required
5. Demo Video
Any server that meets all predefined criteria — firmware version, component presence, IPMI configuration, BIOS settings, and every other checkpoint — is marked PASS automatically.